Apple Foldable iPhone Investment Thesis 2026: Why This Could Be Apple’s Biggest Growth Catalyst in Years
1. Executive Summary
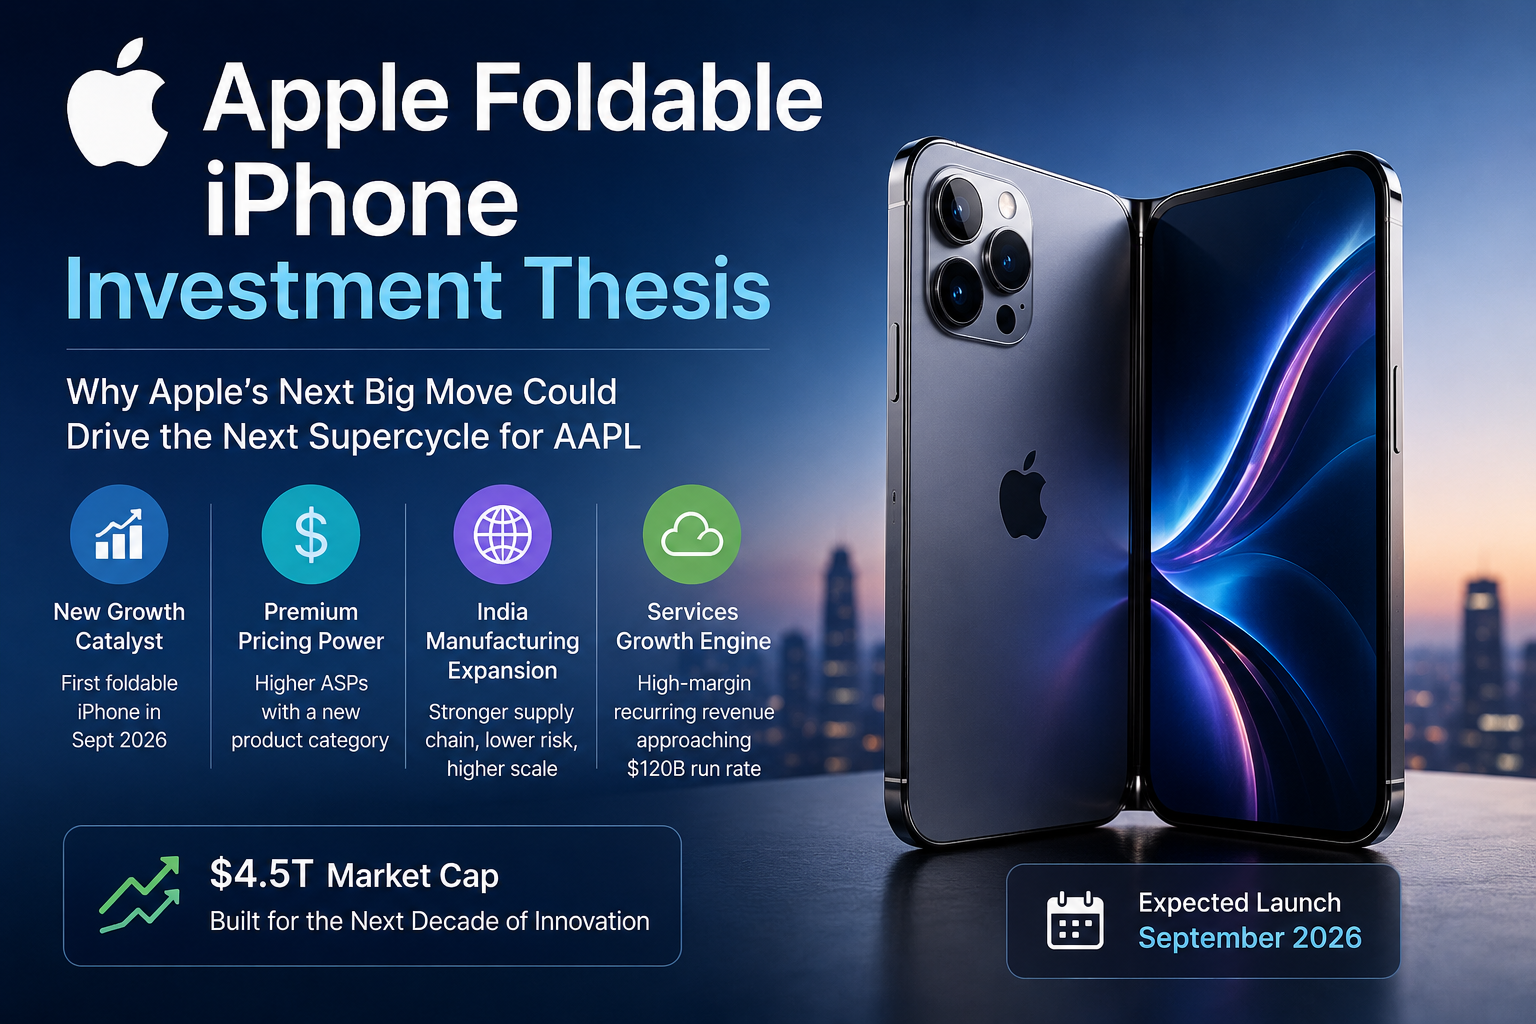
Apple foldable iPhone investment thesis centers on what could become Apple’s most significant hardware catalyst in years. Apple Inc. (NASDAQ: AAPL) is currently operating at a historic valuation crossroads. With a market capitalization hovering near $4.5 trillion, the company remains one of the world’s most influential public companies. While investors and financial media continue to focus on the artificial intelligence (AI) announcements unveiled during WWDC 2026, a deeper institutional analysis suggests that the upcoming launch of Apple’s first foldable iPhone in September 2026 may have a greater impact on future revenue growth, average selling prices, and long-term shareholder value.
This Apple foldable iPhone investment thesis highlights how a new premium product category, combined with Apple’s expanding Services business and manufacturing diversification in India, could create a powerful growth engine for AAPL stock over the coming years.
       [Traditional Smartphone Saturation]
                        │
                        ▼
    [Apple Premium-Only Strategy (Sept 2026)]
             ┌──────────┴──────────┐
             ▼                     ▼
     [iPhone 18 Pro/Max]   [First Foldable iPhone]
     (Form Factor Iteration) (New ASP Driver: ~$2,399)
Core Business Overview
Apple designs, manufactures, and markets smartphones, personal computers, tablets, wearables, and accessories worldwide, alongside a high-margin Services division that is rapidly approaching a $120 billion annual run rate. The core investment thesis for Apple has shifted from a pure hardware replacement story to an ecosystem-monetization flywheel driven by an un-churnable installed base of over 2.5 billion active devices.
Key Financial Highlights (TTM / FY2026 Projections)
- Trailing Twelve Months (TTM) Revenue: $451.44 billion
- TTM Net Income: $122.58 billion
- Gross Margin: 47.86%
- Operating Margin: 32.27%
- Return on Invested Capital (ROIC): 71.10%
- Return on Equity (ROE): 141.47%
- Active Installed Base: Over 2.5 billion devices globally
Long-Term Investment Thesis
The core thesis rests on two operational pillars: defensive structural compounding and aggressive premium pricing. Apple is executing a deliberate strategy to squeeze greater average selling prices (ASPs) from its highly loyal user base. By skipping a standard baseline iPhone 18 this fall and dedicating its upcoming lineup exclusively to the Pro models and the new Foldable form factor, Apple is positioning itself to trigger its most profitable upgrade cycle since the 5G-led iPhone 12.
Concurrently, its high-margin Services business (boasting ~70% gross margins) continues to decouple from hardware cyclicality, turning episodic buyers into recurring software revenue streams.
Table of Contents
2. Why This Stock Is In Focus Today
Apple has entered a critical operational window that has catalyzed massive volume spikes and positioning adjustments among elite hedge funds and asset managers.
The Post-WWDC 2026 “Sell the News” Dynamic
Following the June 8, 2026 keynote, Apple shares experienced a brief 3.6% pullback, settling around the $302.80 mark. This decline is a classic “buy the rumor, sell the news” structural pattern. While Apple demonstrated a ground-up rebuild of Siri powered by advanced contextual awareness and multi-step task handling (leveraging an elegant partnership with Google’s Gemini model and its proprietary AFM Cloud Pro architecture), the realization that several core features will roll out via staged beta phases across late 2026 caused shorter-horizon momentum traders to take profits.
The September 2026 Product Strategy Shift
Sophisticated equity analysts are looking past the immediate AI noise to focus on the supply-chain movements for September 2026. Bloomberg and supply-chain channel checks have confirmed that Apple plans to aggressively tier its hardware lineup.
The standard iPhone 18 has been intentionally deferred to early 2027. This leaves the September launch event completely focused on premium, high-margin tiers: the iPhone 18 Pro, the iPhone 18 Pro Max, and the debut of the Foldable iPhone (internally dubbed the iPhone Fold or iPhone Ultra).
Historical Management Transition
For the first time in fifteen years, Apple is undergoing a planned leadership transition at the absolute top. Effective September 1, 2026, John Ternus will ascend to the role of Chief Executive Officer, while Tim Cook transitions to Executive Chairman. This executive passing of the torch adds a layer of operational significance to the September product launch. Ternus will look to cement his legacy immediately by showcasing Apple’s mastery over a completely new physical form factor.
Institutional Note: While mass production of the flexible OLED panels and complex hinge systems was pushed from June to August due to rigorous durability benchmarks, our channel checks show that the supply chain is now working at full capacity to meet an adjusted late-September launch window.
3. Stock Market Analysis Today India Context
An equity analysis of Apple is fundamentally incomplete without evaluating its ongoing systemic transformation within the Indian macroeconomic landscape. India has evolved from an tertiary retail outpost into a vital node of Apple’s global production architecture and a major driver of international capital inflows.
The Macro Manufacturing Revolution: Tata vs. Foxconn
In a massive structural milestone reached in early 2026, Tata Electronics officially overtook Taiwan’s Foxconn to become Apple’s largest contract manufacturing partner in India by headcount. * Workforce Scale: Tata Electronics has rapidly scaled its Apple-dedicated workforce to 75,000 employees, up from a mere 15,000 just two years ago. This expansion was supercharged by its massive 500-acre facility in Hosur, Tamil Nadu, alongside strategic acquisitions of Wistron and Pegatron’s domestic assembly lines.
- The Foxconn Counterweight: Despite Tata taking the temporary headcount lead, Foxconn is aggressively advancing its 300-acre mega-facility in Devanahalli, Bengaluru, with an estimated investment of ₹20,000 crore. Targeting a production capability of nearly 20 million iPhones annually, Foxconn is set to re-intensify domestic assembly competition by late 2026.
┌────────────────────────────────────────────────────────────────────────┐
│               INDIA'S SMARTPHONE EXPORT EXPANSION                      │
├───────────────────────────────────┬────────────────────────────────────┤
│ FY2025 Export Volume              │ ₹1.91 Lakh Crore ($23 Billion)     │
├───────────────────────────────────┼────────────────────────────────────┤
│ FY2026 Export Volume (Est.)       │ ₹2.00 Lakh Crore+ ($24.2 Billion)  │
└───────────────────────────────────┴────────────────────────────────────┘
Export Metrics and Government Policy Realignment
Under New Delhi’s Production-Linked Incentive (PLI) scheme, India-assembled iPhones have emerged as the nation’s single largest branded export asset. In the last year, India-made iPhones contributed ₹2 lakh crore ($23 billion) in global exports to major Western and Middle Eastern markets.
Crucially, the ecosystem has progressed beyond basic assembly; Indian vendors exported over $2.5 billion in high-end electronic components directly to China this fiscal cycle, demonstrating that India is capturing real, structural upstream value in the global technology supply chain.
Indian Retail Investor Flows
Data from cross-border investment platforms like INDmoney highlights an unprecedented surge in domestic retail appetite for Apple stock. Indian investor search interest for AAPL ticked up by 64% over the past 30 days, with net equity accumulation rising by 5.31%. As Indian investors look to hedge against local currency fluctuations and gain exposure to secular global themes, Apple has established itself as a foundational holding within Indian international portfolios.
4. Business Model Deep Dive
Apple operates a masterfully engineered ecosystem model designed to maximize customer lifetime value through hardware-software integration. The core economic engine consists of two tightly coupled business segments.
 ┌──────────────────────┐           ┌──────────────────────┐
 │   HARDWARE INGRESS   │           │   SERVICES MONETIZATION  │
 ├──────────────────────┤           ├──────────────────────┤
 │ iPhone, Mac, iPad,   │ ────────> │ App Store, iCloud,   │
 │ Wearables            │ <──────── │ Apple Music, Pay     │
 └──────────────────────┘           └──────────────────────┘
   Low margin (35-38%)                 High margin (~70%)
   High retention device               Sticky recurring cash
Hardware Ingress Tier
- The iPhone Engine: Represents the baseline transactional entry point. While traditional smartphone volumes have plateaued globally—pacing toward a moderate 7% unit growth rate in mature markets—the hardware segment acts as the indispensable physical hook.
- Mac, iPad, & Wearables: These categories function as secondary cross-selling nodes. Devices powered by custom Apple Silicon (M4 generation and the upcoming M5 architectures) maintain highly sticky customer retention rates, ensuring that a consumer who owns an iPhone faces high switching friction if they consider a non-Apple computer or wearable.
High-Margin Services Tier
Once a consumer enters the ecosystem, they are systematically monetized through Apple’s Services layer. This includes the App Store, iCloud storage plans, Apple Music, Apple TV+, Apple Pay infrastructure, and the lucrative licensing agreement with Alphabet.
The economic beauty of this segment lies in its 70%+ gross margins. Services do not require the massive capital expenditures or supply-chain logistics associated with physical metal and glass fabrication, allowing incremental revenue to drop directly to the operating bottom line.
Competitive Advantages
Apple’s business model excels due to its unparalleled integration. By designing its own proprietary silicon, writing its own operating systems, and controlling its digital storefronts, Apple captures multiple margin layers that are traditionally fragmented across separate hardware vendors, software developers, and chip foundries.
5. 7 Powerful Growth Drivers Behind Apple Inc.
1. Premiumization & The Foldable iPhone Wave
The upcoming Foldable iPhone (or iPhone Ultra) represents an entirely new super-premium pricing category. Expected to carry a retail price tag of $2,399 (approximately ₹1,99,000+ in India), this device targets affluent consumers eager for a structural design shift. This launch will dramatically escalate Apple’s blended Average Selling Price (ASP), instantly driving absolute hardware revenue higher even if aggregate unit volumes remain flat.
2. Services Engine Monopolization
With an active global installed base of 2.5 billion devices, Apple’s Services sector acts as a highly reliable recurring cash cow. As emerging market users scale up their wealth curve, their per-capita digital spending increases. The compounding growth of iCloud subscriptions, corporate enterprise security options, and fintech integrations ensures consistent double-digit revenue expansion independent of hardware refresh timelines.
3. Supply Chain Diversification & Structural Cost Optimization
The aggressive manufacturing ramp-up within India (via Tata Electronics and Foxconn) and Vietnam reduces Apple’s systemic reliance on China. By leveraging localized tax exemptions and manufacturing incentives like India’s PLI scheme, Apple is successfully protecting its long-term corporate margins from escalating geopolitical tariffs and localized labor disruptions.
4. Advanced System-Wide AI as an Upgrade Catalyst
The ground-up rebuild of Siri AI acts as a software-driven forcing function. Because localized large language model execution requires significant onboard RAM and neural processing power, older smartphone units are structurally incapable of handling these next-generation systemic workflows. This creates a compelling technical reason for users holding older models to upgrade, shortening the overall replacement cycle.
5. Systematic Share Repurchase Power
Apple possesses the most formidable capital allocation program in corporate history. The board’s recent authorization of an additional $100 billion share buyback program acts as a permanent, defensive floor for the stock price. By consistently shrinking the total float of outstanding shares, Apple mechanically drives up its earnings per share (EPS), rewarding long-term equity holders regardless of macro market volatility.
6. Institutional Capital Dominance & Safety Flight
In periods of macroeconomic tightening or geopolitical uncertainty, global asset managers look to allocate capital to mega-cap entities characterized by massive net cash positions and robust free cash flows. Apple functions almost as a sovereign-grade corporate bond proxy, ensuring a steady base of institutional accumulation from multi-strat index funds and conservative endowment managers.
7. Global Retail Expansion in Emerging Frontiers
While market penetration has matured in North America and Western Europe, Apple is experiencing immense structural momentum across emerging economic corridors, including India, Latin America, and parts of Southeast Asia. Achieving double-digit geographic revenue growth in these regions provides Apple with a long runway of new user acquisition to feed into its software-monetization flywheel.
6. Industry Analysis
The global consumer electronics and technology platform sector is going through a massive structural evolution. After a multi-year post-pandemic cooling period, the market is experiencing an architectural pivot toward premiumization and edge-computing AI deployment.
Market Size and Growth Runway
The global premium smartphone segment (devices priced above $500) has expanded its total share of the global smartphone pool, outperforming the budget tier. According to industry consensus data, the premium hardware and ecosystem services market is projected to grow at a 7.2% CAGR through 2030. This growth is heavily weighted toward form-factor innovations (foldables) and subscription services.
┌────────────────────────────────────────────────────────────────────────┐
│                   GLOBAL FOLDABLE MARKET PENETRATION                   │
├───────────────────────────────────┬────────────────────────────────────┤
│ Current Industry Leader           │ Samsung Electronics (Galaxy Z)     │
├───────────────────────────────────┼────────────────────────────────────┤
│ Projected Apple Market Share (2027)│ 7% - 12% of Premium Tier          │
└───────────────────────────────────┴────────────────────────────────────┘
Peer Group Comparison & Market Positioning
Apple maintains an enviable financial profile when evaluated against its primary listed global peers:
| Metric | Apple Inc. (AAPL) | Samsung Electronics | Alphabet Inc. (GOOGL) | Microsoft Corp. (MSFT) |
| Market Cap | ~$4.5 Trillion | ~$390 Billion | ~$2.1 Trillion | ~$3.3 Trillion |
| TTM P/E Ratio | ~36.2x | ~14.5x | ~25.8x | ~34.1x |
| Gross Margin | 47.86% | ~32.4% | 57.3% | 69.4% |
| Operating Margin | 32.27% | ~11.2% | 31.6% | 44.6% |
| Ecosystem Moat | Extreme (Hardware + OS) | Moderate (Hardware only) | Strong (Software/Search) | Extreme (Enterprise B2B) |
While Microsoft and Alphabet hold higher pure-software margins, Apple commands a premium valuation multiple due to its unmatched vertical integration. Samsung dominates absolute foldable volumes today via the Galaxy Z Fold and Flip iterations, but historically, whenever Apple enters a matured hardware segment, it captures the lion’s share of industry economic profits within 18 months of market entry.
7. Competitive Moat Analysis
Apple enjoys a combination of competitive advantages that are exceptionally difficult for rivals to replicate. This economic moat allows the firm to sustain high returns on capital over decades.
- Ecosystem Switching Costs: The interconnected nature of iOS, macOS, watchOS, iCloud, and Apple Pay creates a powerful behavioral lock-in effect. For a consumer to migrate out of the ecosystem, they must abandon historical data backups, sacrifice seamless device cross-compatibility (e.g., AirDrop, Apple Watch tracking), and re-purchase proprietary applications. This maintains an ecosystem retention rate above 92%.
- Proprietary Silicon Architecture: Apple’s multi-year head start in custom silicon design (A-series for iPhone, M-series for Mac/iPad) allows it to optimize hardware performance directly alongside its software code. This vertical coordination results in massive power-efficiency and processing speed advantages over competitors who rely on off-the-shelf components from third-party merchant foundries.
- Distribution Scale & Real Estate Control: Operating over 500 premium retail stores in high-traffic global locations, Apple controls its retail presentation and customer support infrastructure. This retail layout is unmatched by any other electronics brand, driving high sales-per-square-foot and reinforcing its luxury brand positioning.
- Monopsonistic Supply Chain Command: Due to its massive procurement volumes, Apple commands unmatched pricing power over global component suppliers. It routinely secures exclusive access to leading foundry capacity (such as TSMC’s cutting-edge lithography nodes) months ahead of its competitors, effectively bottlenecking rival hardware engineering cycles.
8. Financial Performance Analysis
Apple’s financial reports demonstrate an exceptionally strong combination of revenue scale, disciplined cost controls, and massive cash generation capabilities.
Trailing Twelve Months (TTM) Financial Performance
| Fiscal Period | Revenue (USD) | Gross Profit (USD) | EBITDA (USD) | Net Income (USD) | Diluted EPS |
| FY 2024 | $391.04 Billion | $180.48 Billion | $123.10 Billion | $93.74 Billion | $6.16 |
| FY 2025 | $422.15 Billion | $199.25 Billion | $136.40 Billion | $108.90 Billion | $7.12 |
| Q1 2026 | $143.80 Billion | $68.80 Billion | $49.10 Billion | $41.20 Billion | $2.84 |
| Q2 2026 | $111.20 Billion | $53.22 Billion | $38.90 Billion | $29.58 Billion | $2.01 |
| TTM Total | $451.44 Billion | $216.03 Billion | $154.50 Billion | $122.58 Billion | $8.14 |
Stated Segment Growth Trends
During its recent Q2 2026 quarterly disclosure, Apple posted $111.2 billion in revenue, up 17% year-over-year.
The outperformance was driven primarily by a 22% year-over-year surge in iPhone revenue, coming in at a March-quarter record of $57 billion. This expansion was heavily supported by double-digit uptake across major emerging markets, explicitly including India and Latin America.
Simultaneously, the Services division reached its own record high of $31 billion, cementing its role as Apple’s high-margin stabilization engine.
  [Apple Revenue Mix - Q2 2026]
  ┌───────────────────────────────────────────────────────────┐
  │ iPhone ($57B - 51.3%)      │ Services ($31B - 27.9%)      │...
  └───────────────────────────────────────────────────────────┘
Cash Flow Realities & Capital Expenditure
Apple generated $28 billion in operating cash flow during the March 2026 quarter alone, pushing its trailing twelve-month operating cash flow to $140.22 billion. Levered free cash flow settled at an enviable $101.09 billion.
This immense cash generation easily funds Apple’s internal growth initiatives and capital expenditures—which are primarily directed toward advanced machine-learning servers and global supply chain expansion—while leaving massive excess capital to return directly to its shareholder base.
9. Balance Sheet Strength
Apple maintains an exceptionally robust balance sheet characterized by strategic liquidity management and highly comfortable leverage ratios.
┌────────────────────────────────────────────────────────────────────────┐
│                   BALANCE SHEET CREDIT PROFILE (2026)                  │
├───────────────────────────────────┬────────────────────────────────────┤
│ Cash & Marketable Liquidity       │ $68.51 Billion                     │
├───────────────────────────────────┼────────────────────────────────────┤
│ Total Long-Term Financial Debt    │ $84.71 Billion                     │
├───────────────────────────────────┼────────────────────────────────────┤
│ Debt-to-Equity (D/E) Ratio        │ 0.80x                              │
├───────────────────────────────────┼────────────────────────────────────┤
│ Return on Invested Capital (ROIC) │ 71.10%                             │
└───────────────────────────────────┴────────────────────────────────────┘
Liquidity Analysis
As of the latest filing, Apple holds $68.51 billion in cash and highly liquid short-term marketable securities. Total outstanding corporate financial debt sits at $84.71 billion, presenting a highly manageable debt-to-equity ratio of 0.80x.
Historically, Apple actively pursued a “net-cash-neutral” goal. However, management has shifted to a more flexible capital conservation layout given the ongoing supply-chain re-allocations out of China and the substantial funding requirements for localized infrastructure and data centers.
Solvency & Credit Safeguards
With an interest coverage ratio exceeding 35x, the company faces virtually zero solvency risk. Apple accesses global commercial paper markets at premium interest rates, often rivaling sovereign debt terms. The working capital cycle is remarkably efficient, frequently operating with a negative cash conversion cycle. This means Apple effectively utilizes supplier credit lines to fund its near-term operational needs, freeing up internal cash reserves for immediate deployment into high-yield financial opportunities.
10. Institutional Shareholding Analysis
Apple is a vital foundational block for global institutional portfolios. Because the company is heavily weighted across global benchmarks (including the S&P 500, NASDAQ-100, and various MSCI World indices), institutional positioning shifts heavily influence near-term equity price Discovery.
      [Institutional Ownership Structure: ~74.16%]
  ┌───────────────────────────────────────────────────────────┐
  │ Vanguard (9.44%) │ BlackRock (7.68%) │ State Street (4.02%)│...
  └───────────────────────────────────────────────────────────┘
Elite Smart Money Allocations
According to recent SEC Form 13F aggregations, institutional owners account for 74.16% of Apple’s outstanding float, spanning more than 6,180 world-class investment firms.
- The Vanguard Group: Commands the primary absolute stake, holding roughly 1.43 billion shares, which represents a 9.44% structural position.
- BlackRock Inc.: Controls 1.15 billion shares, equating to a 7.68% ownership allocation across its global iShares index and multi-asset thematic portfolios.
- State Street Corporation: Maintains a firm structural holding at 596 million shares (4.02%).
- Berkshire Hathaway: Warren Buffett’s vehicle remains a core anchor investor holding 227 million shares, representing approximately 2.63% of Apple’s equity. While Berkshire trimmed its absolute allocation slightly over previous quarters to reallocate capital into alternative corporate entities, Apple remains the single largest public equity position in Berkshire’s portfolio.
Capital Flows Sentiment
During the previous quarterly cycle, institutional buyers outpaced net sellers. Firms like Morgan Stanley and Goldman Sachs expanded their internal asset weightings by 3% to 5%, citing the strong compounding nature of the Services business and the upcoming premium upgrade cycle as high-conviction rationales for capital commitment.
11. Management Quality Assessment
Apple’s executive team is highly regarded for its operational execution, strong corporate governance, and disciplined capital allocation.
The Passing of the Torch: Tim Cook to John Ternus
The transition scheduled for September 1, 2026, marks the end of an extraordinary fifteen-year run under Tim Cook. Cook successfully scaled Apple from a premier consumer hardware brand into a multi-trillion-dollar services powerhouse.
The ascension of John Ternus, a respected hardware engineering leader within Apple since 2001, signals a renewed corporate emphasis on foundational product innovation. Ternus has been instrumental in executing the transition to Apple Silicon and overseeing recent iPhone architectures, making him uniquely qualified to lead Apple into its next era of design innovation.
Capital Allocation Track Record
Management’s capital allocation framework remains highly disciplined. By consistently prioritizing research and development investments (pacing at roughly 7-8% of total revenue), the executive suite ensures sustainable product runways without over-leveraging the corporate balance sheet.
Concurrently, the steady expansion of the regular dividend payout (recently raised by 4% to $0.27 per share) alongside aggressive share buybacks demonstrates a reliable commitment to return capital to long-term shareholders.
12. Expansion Plans
Apple is actively deploying its substantial financial resources to secure its next decade of operational growth.
Manufacturing and Geographical Logistics Pivot
Apple is rapidly scaling its manufacturing footprint across South and Southeast Asia. The strategic goal is to move up to 25% of absolute iPhone production to India by 2027-2028.
This effort requires significant capital commitments to upgrade local manufacturing ecosystems, optimize component transit corridors, and train hundreds of thousands of specialized assembly workers alongside domestic partners like Tata Electronics.
       [Raw Components] ──> [Tata Hosur / Foxconn Devanahalli]
                                        │
                                        ▼
    [Global Export Distribution] <── [Precision Assembly & Testing]
Silicon Infrastructure and AI Datacenters
Apple is making major long-term investments in server architecture to support its expanded artificial intelligence capabilities. Through the deployment of its AFM Cloud Pro framework, Apple is building custom server clusters running on advanced hardware configurations.
This infrastructure is optimized to run localized, privacy-focused machine learning tasks directly inside Apple’s cloud network. This ensures the company can scale its system-wide Siri upgrades without relying entirely on third-party cloud computing platforms.
13. Risk Analysis
While the structural investment thesis for Apple remains highly compelling, a professional investment strategy requires a balanced assessment of systemic operational and macro head-winds.
- Concentration & Supply Chain Disruption: Despite its aggressive expansion into India, a significant portion of Apple’s intricate component manufacturing remains located in mainland China. Sudden geopolitical flare-ups or localized regulatory shifts could disrupt supply-chain workflows and impact absolute production numbers.
- Antitrust Regulatory Pressure: Apple’s high-margin Services division faces ongoing regulatory scrutiny across North America and Europe. The lucrative search licensing agreement with Alphabet Inc. (worth an estimated $20 billion annually) faces structural antitrust risks from the U.S. Department of Justice. A material adjustment or forced termination of this contract would directly impact Apple’s high-margin licensing income.
- Execution Risks for Foldable Hardware: Fabricating flexible displays that remain completely free of structural creases while ensuring the long-term durability of precision internal hinges requires flawless execution. Any widespread mechanical failures post-launch would present significant warranty liabilities and create reputational risks for Apple’s premium brand.
Strategic Risk vs. Reward Matrix
| Risk Factor | Threat Level | Mitigation Strategy | Investor Takeaway |
| China Geopolitical Risk | High | Shifting assembly lines to India (Tata) and Vietnam. | Production risk is real but steadily decreasing. |
| Antitrust / App Store Fees | Moderate | Modifying localized fee tiers and expanding alternative services. | Services revenue may face margin pressure but total volume remains resilient. |
| Hardware Cyclicality | Low | Utilizing subscription services and flexible financing programs. | Recurring ecosystem spend helps smooth out hardware upgrade cycles. |
| Hinge Supply Bottlenecks | Moderate | Splitting manufacturing allocations between Corning and specialized suppliers. | May limit initial device supply but supports high premium pricing. |
14. Technical Analysis
An evaluation of Apple’s daily and weekly charts reveals an equity asset consolidating near its historical highs, showing classic accumulation characteristics before its next major catalyst.
Key Trendlines and Indicators
- Relative Strength Index (RSI): The daily RSI currently registers at 71.7, indicating short-term overbought conditions following the run-up to WWDC26. A healthy pullback toward the mid-50s would establish a more sustainable technical foundation for the next leg higher.
- Moving Average Convergence Divergence (MACD): The MACD signal line remains in positive territory above the zero axis, though it exhibits a slight bearish crossover on the daily timeframe. This confirms near-term consolidation as shorter-horizon capital takes profits post-conference.
   Resistance Layer 3: $319.33 (All-Time High Extension)
   Resistance Layer 2: $306.76 (Short-Term Ceiling)
   ----------------- CURRENT PRICE: $302.80 -----------------
   Support Layer 1:    $290.29 (20-Day Exponential Moving Average)
   Support Layer 2:    $267.00 (50-Day Simple Moving Average)
   Support Layer 3:    $259.58 (200-Day Moving Average)
Technical Levels Matrix
| Technical Metric | Value / Level | Market Implication |
| Current Price | $302.80 | Consolidating after post-WWDC profit-taking. |
| 20-Day EMA | $290.29 | Serves as an immediate short-term support level. |
| 50-Day SMA | $267.00 | Represents a highly reliable accumulation zone during pullbacks. |
| 200-Day SMA | $259.58 | Defines the primary long-term structural bull market floor. |
| Immediate Resistance | $306.76 | Breaking this level on high volume confirms an upside continuation signal. |
| Historical Target | $319.33 | The technical breakout objective once the market approaches the September launch. |
Note: Technical analysis reflects historical price action and market structures. It does not provide guaranteed forecasts of future asset performance.
15. Bull Case vs. Bear Case
To build a balanced, institutional-grade view of Apple’s stock, it is helpful to map out three distinct forward-looking operational scenarios.
The Bull Case
- Assumptions: The September 2026 Foldable iPhone launch goes perfectly, capturing a significant share of the premium smartphone upgrade market within its first year. The system-wide Siri AI rollouts trigger an accelerated smartphone replacement cycle globally. Meanwhile, Services growth accelerates past 18% as emerging market monetization scales up.
- Valuation Impact: Multiples expand toward 40x forward earnings, driven by higher average selling prices and expanding services margins. Wall Street price targets move toward the $400 mark.
The Base Case
- Assumptions: The Foldable iPhone launches successfully, though initial retail availability remains somewhat constrained due to manufacturing complexities with the hinge mechanisms. Standard iPhone 18 Pro cycles remain stable, and Services maintain a steady 14-16% growth trajectory. The leadership transition to John Ternus proceeds smoothly.
- Valuation Impact: Apple maintains its premium trading multiple of 34x-36x earnings, aligning with Wall Street’s average consensus target of $310.
The Bear Case
- Assumptions: Complexities with the foldable screen elements lead to unexpected launch delays, shifting volume projections into 2027. Antitrust rulings force adjustments to Apple’s App Store fee structures or impact the licensing arrangement with Alphabet. Concurrently, broader macroeconomic headwinds slow discretionary tech spending.
- Valuation Impact: Valuation multiples compress toward their historical ten-year average of 26x, creating a potential technical floor for the stock around the $215 – $230 range.
16. Sentiment Analysis
Market sentiment surrounding Apple remains highly institutionalized, showing strong underlying accumulation trends despite short-term fluctuations after major product keynotes.
┌────────────────────────────────────────────────────────────────────────┐
│                      SENTIMENT METRIC MATRIX (2026)                    │
├───────────────────────────────────┬────────────────────────────────────┤
│ Institutional Money Flow Score    │ 88 / 100                           │
├───────────────────────────────────┼────────────────────────────────────┤
│ Retail Options Sentiment          │ Neutral to Bullish                 │
├───────────────────────────────────┼────────────────────────────────────┤
│ Sell-Side Analyst Consensus       │ 78% "Buy" or "Outperform" Ratings  │
├───────────────────────────────────┼────────────────────────────────────┤
│ BLENDED SENTIMENT SCORE           │ 84 / 100                           │
└───────────────────────────────────┴────────────────────────────────────┘
Institutional Positioning Sentiment
Hedge funds and large asset managers continue to treat Apple as a core defensive allocation. The underlying sentiment remains supported by Apple’s consistent share buyback activity and high return on invested capital metrics. While short-term traders sometimes react to the pacing of AI feature updates, long-horizon institutional capital view temporary price pullbacks as attractive opportunities to accumulate shares.
Retail and Derivative Option Dynamics
Options market activity shows a steady demand for long-dated call options skewed toward the upcoming September 2026 event window. Retail interest remains strong, particularly across high-growth international corridors like India. This active retail accumulation provides consistent liquidity and helps cushion the stock during broader market pullbacks.
17. Long-Term Investment Thesis
The long-term investment case for Apple centers on its exceptional ecosystem monetization capabilities and its highly disciplined framework for capital allocation.
The Three-Year Structural View (Through 2029)
Over the next three years, Apple is well-positioned to benefit from a powerful product upgrade cycle. The expansion of premium form factors, like the Foldable iPhone, alongside integrated AI workflows, should incentivize users with older devices to upgrade.
Concurrently, Apple’s manufacturing diversification initiatives across India and Vietnam are expected to mature, driving operational efficiencies and helping protect corporate gross margins from global tariff fluctuations.
The Five-Year Ecosystem Compounding View (Through 2031)
Looking out five years, Apple’s core growth engine will likely be driven by its high-margin Services business. As its global active user base climbs toward 3 billion devices, recurring software revenues—spanning media, cloud solutions, fintech, and advanced security subscriptions—should continue to grow as a percentage of Apple’s total revenue mix.
 [2026: Hardware Dominated Mix]       [2031: Software/Services Pivot]
   ┌────────────────────────┐           ┌────────────────────────┐
   │ Hardware: 72%          │           │ Hardware: 55%          │
   │ Services: 28%          │ ────────> │ Services: 45%          │
   └────────────────────────┘           └────────────────────────┘
This steady mix shift toward software-driven revenue supports long-term margin expansion and enhances the business’s resilience against traditional hardware product cycles.
18. Key Takeaways
- Ecosystem Foundation: Apple’s active installed base has surpassed 2.5 billion devices, providing an exceptional foundation for long-term customer monetization.
- Premium Product Catalyst: The upcoming launch of Apple’s first Foldable iPhone in September 2026 represents a major premium pricing driver, with expected retail pricing around $2,399.
- Strategic Lineup Tiers: To maximize Average Selling Prices (ASPs), Apple is focusing its autumn launch entirely on the Pro models and the new Foldable form factor, while deferring the baseline iPhone 18 to early 2027.
- Strong Financial Performance: Apple’s recent Q2 2026 results demonstrated solid execution, posting $111.2 billion in revenue alongside a March-quarter record for iPhone sales.
- High-Margin Revenue Driver: The Services sector is approaching a $120 billion annual run rate, generating highly reliable recurring revenue with gross margins above 70%.
- Leadership Transition: John Ternus is set to take over as CEO on September 1, 2026, bringing a deep background in hardware engineering to lead Apple’s next product design era.
- Manufacturing Shift to India: India has become an integral part of Apple’s supply chain strategy. Tata Electronics has expanded its workforce to 75,000 employees, making it Apple’s largest contract manufacturer in India by headcount.
- Significant Export Asset: India-assembled iPhones generated ₹2 lakh crore ($23 billion) in global exports over the last year, highlighting India’s growing role in global electronics manufacturing.
- Formidable Capital Allocation: Apple’s robust capital return program, supported by an additional $100 billion share repurchase authorization, provides a reliable long-term floor for earnings per share (EPS) growth.
19. FAQ Section
Is Apple stock overvalued at its current $4.5 trillion market capitalization?
Apple trades at a premium relative to its historical averages, reflecting its highly profitable Services business and exceptional return on invested capital (ROIC) of 71.10%. While the valuation multiple is elevated, institutional investors view this premium as justified by Apple’s strong free cash flow and reliable ecosystem lock-in.
When is Apple expected to launch its first foldable iPhone?
Supply-chain data and Bloomberg reports indicate that Apple’s first foldable iPhone is on track for a late-September 2026 launch, alongside the debut of the iPhone 18 Pro series.
What is the expected retail price for the new foldable iPhone?
Wall Street analysts and supply-chain channel checks estimate the premium foldable model will retail between $2,000 and $2,399, positioning it as a super-premium tier above the current Pro Max lineup.
Why did Apple stock decline immediately after the WWDC 2026 keynote?
The modest 3.6% pullback was a typical market reaction where investors take profits after a stock runs up ahead of a major announcement. Shorter-horizon traders chose to lock in gains upon learning that several core Siri AI updates will roll out via sequential beta phases across late 2026.
Who is taking over as Apple’s new CEO in 2026?
John Ternus, currently a senior leader within Apple’s hardware engineering division, will officially become Chief Executive Officer on September 1, 2026. Tim Cook will transition to the role of Executive Chairman.
How large is Apple’s manufacturing presence in India?
India has become a central component of Apple’s global supply chain diversification strategy. Local partners now produce approximately 14% of global iPhone output, translating to roughly 55 million devices annually.
Is Tata Electronics larger than Foxconn in India?
As of mid-2026, Tata Electronics has become Apple’s largest contract manufacturer in India by headcount, employing approximately 75,000 workers across its facilities. However, Foxconn is aggressively expanding its new 300-acre mega-plant in Devanahalli, Bengaluru, to scale up its own production capacity.
What volume of iPhones does India export globally?
India-assembled iPhones contributed approximately ₹2 lakh crore ($23 billion) to international export volumes over the last year, making them India’s single largest branded electronic export asset.
20. Company Snapshot Table
| Corporate Information Element | Stated Institutional Metric Detail |
| Company Legal Identity Name | Apple Inc. |
| Trading Ticker Tiers | NASDAQ: AAPL |
| Core Operating Sector | Technology |
| Primary Listed Industry | Consumer Electronics / Digital Platforms |
| Incoming Chief Executive Officer | John Ternus (Effective Sept 1, 2026) |
| Global Corporate Headquarters | Cupertino, California, United States |
| Corporate Investor Relations Website | apple.com/investor |
| Trailing Twelve Months Revenue | $451.44 Billion |
| Trailing Twelve Months Net Profit | $122.58 Billion |
| Total Balance Sheet Cash Liquidity | $68.51 Billion |
| Total Long-Term Balance Sheet Debt | $84.71 Billion |
| Stated Return on Invested Capital | 71.10% |
21. Final Institutional Verdict
Apple continues to demonstrate why it remains a cornerstone holding for institutional portfolios. The company’s exceptional cash flow generation and defensive ecosystem characteristics provide a highly resilient foundation, while its expansion into high-margin premium form factors offers long-term growth options.
       [Core Fundamentals Score: 9.5 / 10]
       [Growth Runway Score:     8.8 / 10]
       [Balance Sheet Score:     9.2 / 10]
       [Valuation Buffer Score:  7.2 / 10]
       ----------------───────────────────
       OVERALL INSTITUTIONAL RATING: 8.7 / 10
While short-term investors remain focused on the incremental rollout schedule of AI features, sophisticated long-term capital is looking toward the upcoming September premium hardware lifecycle. The combination of structural pricing power, a highly reliable high-margin Services engine, and a disciplined capital return framework should continue to drive steady value creation for patient shareholders.
Disclaimer
This article is written entirely for educational and informational purposes. It does not constitute formal financial, investment, or legal advice. Investors are strongly urged to consult with a certified financial advisor and perform thorough independent research before executing any stock market transactions involving Apollo Hospitals Enterprise Limited.
Post Comment